Data model
A recording means little on its own. To interpret, compare or reproduce it, one needs to know which animal or tissue it came from, what was done to it beforehand, where in the brain the electrode or fiber sat, which hardware and reagents were used, what the animal was doing, and under which approval the work was done. In most labs this context is spread over surgery sheets, notebooks, spreadsheets and file names, and much of it leaves with the people who wrote it.
BrainSTEM records this context as linked, structured records in a relational data model. Each record describes one thing: a subject, a procedure, a session, an implanted probe. The links between records carry the scientific relations. An implant procedure creates an experimental interface; a data acquisition names the interfaces it recorded through and so inherits their anatomical target and hardware; a session links the subjects or specimen sets it was performed on. A question such as which mice received a virus injection in CA1 and were later recorded with a silicon probe during a running task becomes a query over records instead of a search through notes.
Three principles shape the model:
- Shared vocabularies for comparison. Species, strains, brain regions, behavioral paradigms and regulatory authorities come from shared taxonomies; anatomical positions are coordinates in a named atlas; reagents and devices come from a shared catalog, where an entry can carry its RRID. Records from different labs use the same terms.
- Method-specific detail. Procedures, recordings, manipulations, interfaces, materials and logs have a type, such as a silicon probe implant, a virus injection or two-photon imaging. Each type has its own fields, validated against a versioned JSON schema, so a record holds the parameters that matter for that method.
- Metadata, not raw data. BrainSTEM describes the experiment and records where the data are stored; the recordings themselves stay in the lab’s storage. Records export as JSON or convert to Neurodata Without Borders (NWB) files for archiving and sharing, for example on DANDI.
Records belong to projects, which decide who can see and edit them, so a lab keeps its work private until it chooses to share or publish it.
The model at a glance
The Overview below is a drawing of the whole model; the Interactive view is the complete current model, copied from the BrainSTEM server’s public reference: every model as a card with its fields, every relation, where each model inherits its permissions from, and the fields of every type. Expand opens it with its search, layouts, layers and detail panel. The same diagram is embedded on each model page, focused on that model, and is available inside BrainSTEM from the Help menu and the Graph tab of every help dialog.
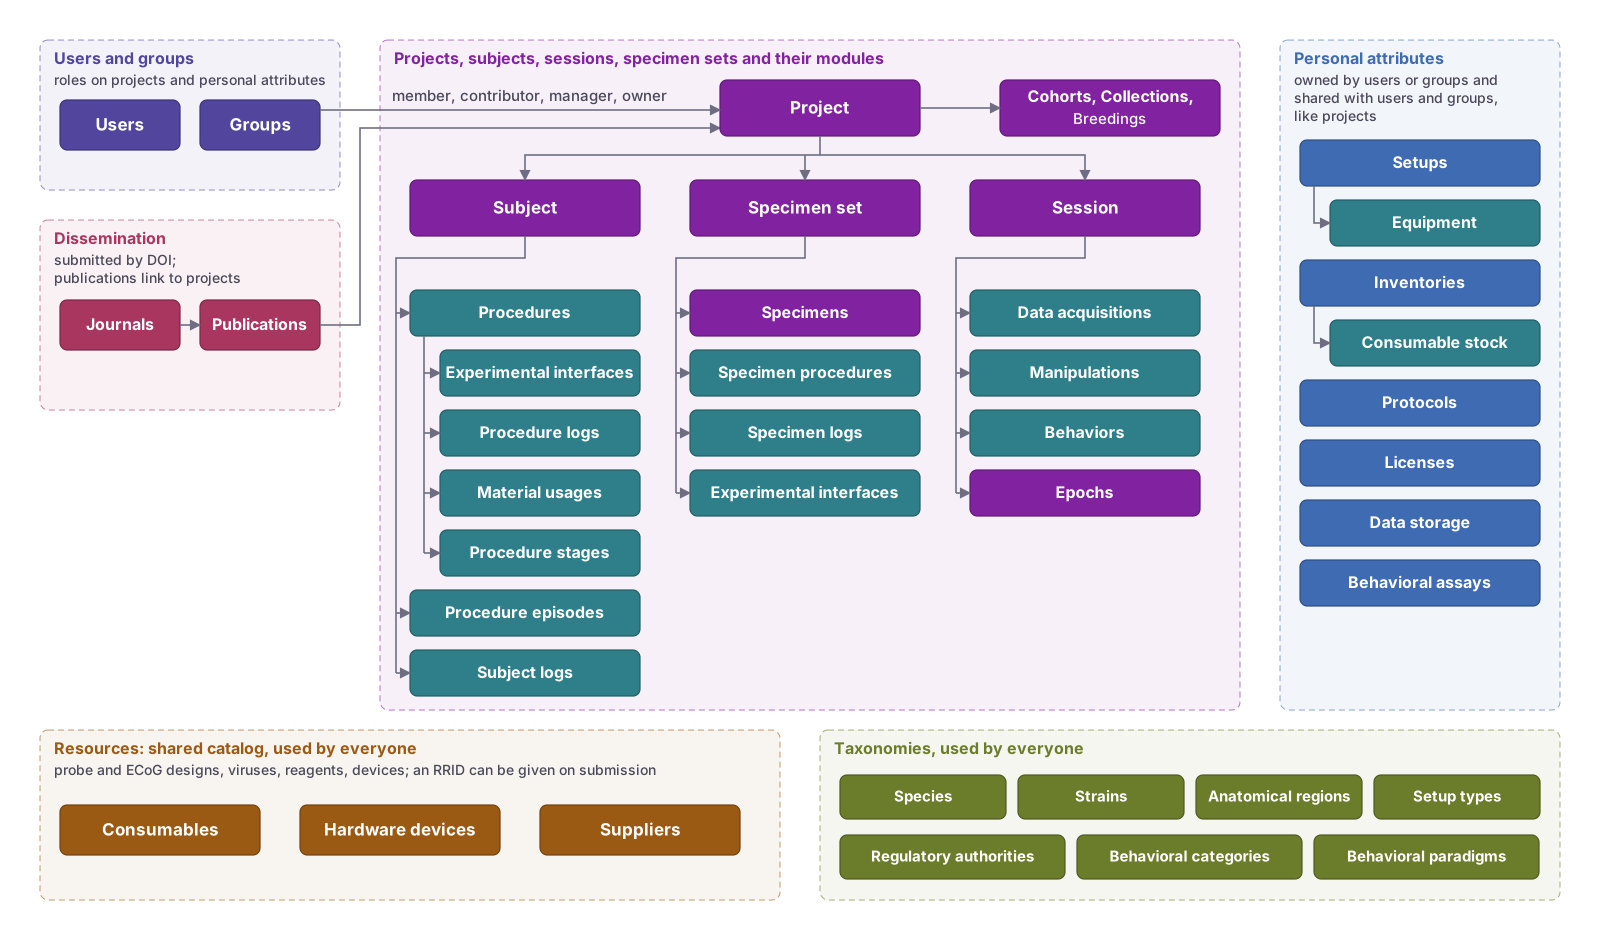
Click the drawing to see it in full size. It shows the core models; switch to Interactive for the complete model with all fields and relations.
Drag to pan, Ctrl + scroll to zoom and hover a model to see its connections; Reset view returns to this view. Expand opens the full diagram, where you can click a model to read about it and use its search, layouts, layers and detail panel.
Where do I record it?
What happened decides which kind of entry records it: an action on a subject, an observation over time, a device that stays in place, tissue taken out, or what was measured, delivered or done in a session.
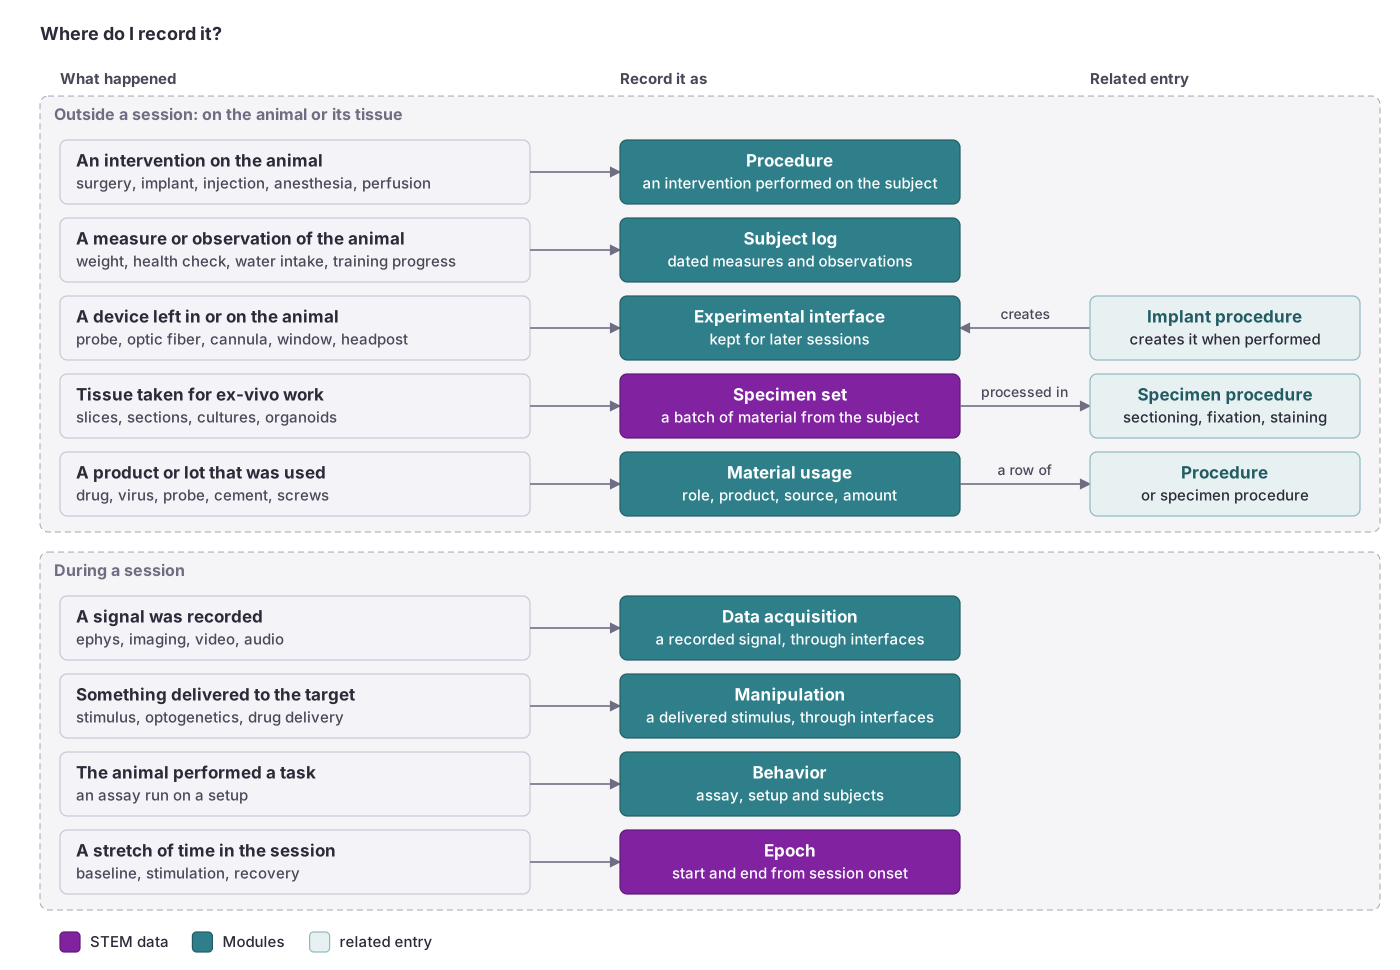 Which kind of entry records what happened. Each kind has its own page under Organization of the models.
Organization of the models
The model is structured into these main categories:
- Projects: the organizational unit of a study. Projects hold the subjects, specimen sets and sessions, define who can see and edit them, and link to publications.
- Subjects: the animals studied in vivo, with their species, strain, sex and lifecycle status. Related records: Procedures, Procedure episodes, Subject logs, Procedure logs, Experimental interfaces, Breedings and Cohorts.
- Specimen sets: ex-vivo material prepared together, such as a slice series, a section series, an organoid batch, a culture or a well plate, usually taken from a subject. Related records: Specimens, Specimen procedures and Specimen logs.
- Sessions: experimental sessions on subjects or specimen sets. Related records: Behaviors, Data acquisition, Manipulations, Epochs and Collections.
- Materials: the chain from the shared consumable catalog through a lab’s stock to the material usage rows that record what a procedure used or what an interface is made of, and the stages materials take part in.
- Templates: reusable prefills for procedures, episodes, specimen procedures, experimental interfaces, data acquisitions, manipulations and material usages.
- Personal attributes: a lab’s own resources, shared through groups: Setups with their equipment, Inventories with their consumable stock, Behavioral assays, Data storage, Licenses and Protocols.
- Resources: the shared catalog used by every lab: Consumables (probe designs, ECoG arrays, virus constructs, reagents), Hardware devices and Suppliers.
- Taxonomies: controlled vocabularies: species, strains, anatomical regions organized by atlas, coordinate transforms, behavioral categories and paradigms, setup types and regulatory authorities.
- Dissemination: publications, submitted by DOI, and journals.
- Users: users, groups and laboratories, and the permissions built on them.
Expandability, permissions, schemas
- Expandability: how the model grows through new types, taxonomies and resources while every record stays standardized.
- Permissions: object-level permissions that inherit from projects, groups and personal attributes.
- Schemas: the type-specific, versioned JSON schemas behind every modular record.
Example usage of the flexible modular design
The figure below shows how the data model applies to an extracellular recording session during a behavioral experiment in a rat. Colours follow the apps of the interactive data model: the project, subject and session (STEM data) are purple, the procedures, interface and session modules (Modules) teal, and the coordinates, which are fields of a procedure, grey. The implant procedure carries its materials and coordinates and creates the experimental interface that the recording names, so the recording inherits where and with what it was made.
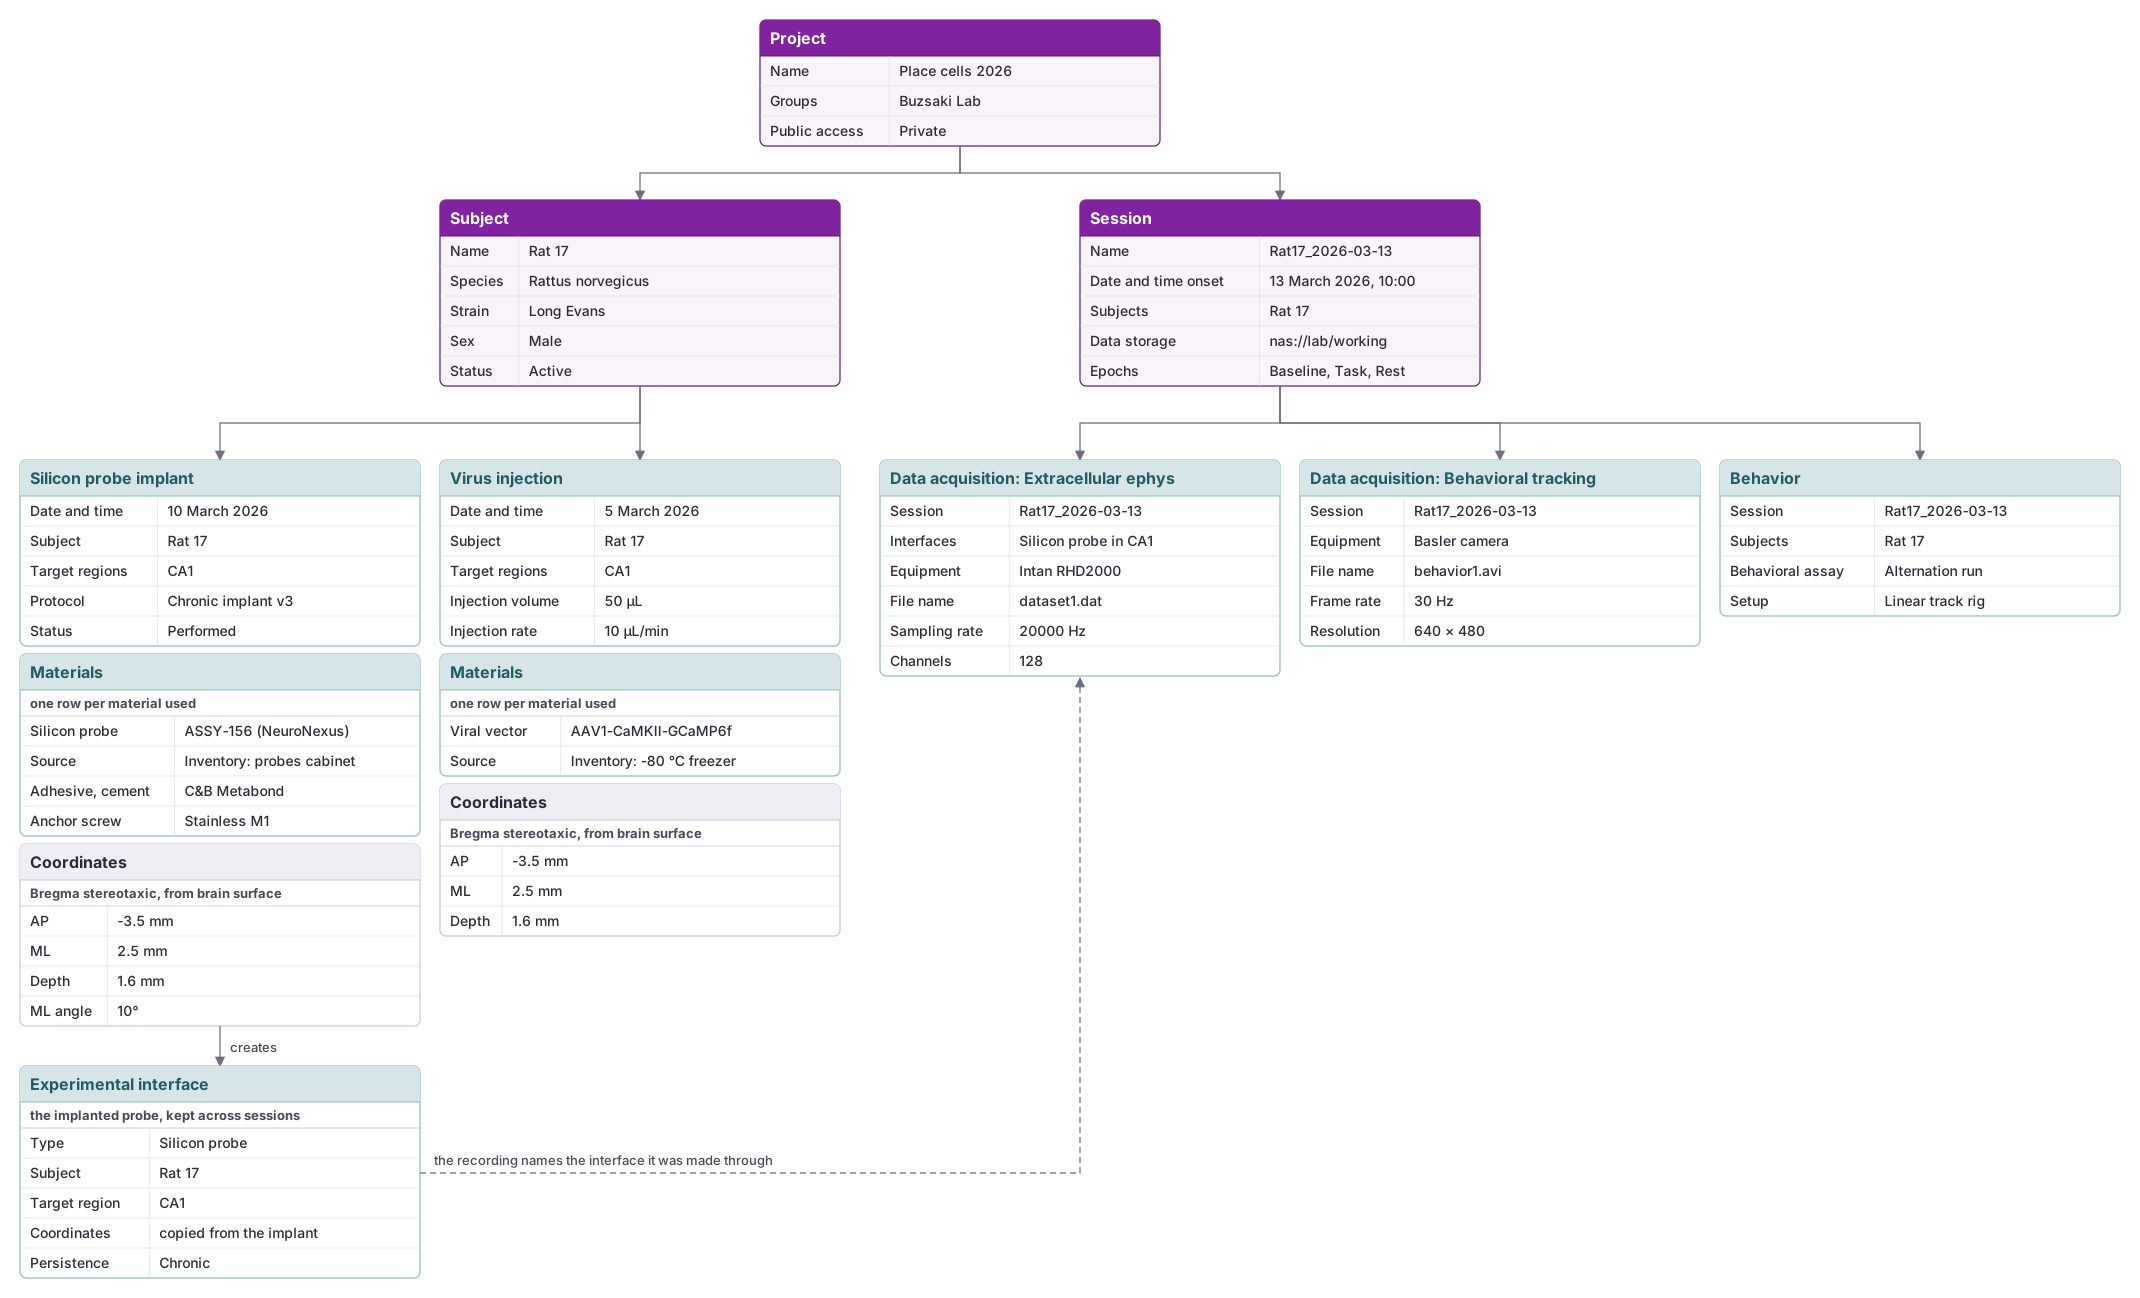 Click the figure to open it at full size.