Single entry view
Table of contents
- Overview
- Header buttons
- Fields and details
- Related entries
- Data graph
- Revision history
- Recover
- Public portal
- Related
Overview
Every entry has a details page that shows all its fields, its type-specific details and its related entries in one read-only view. Open it by clicking an entry name in a list, in a dashboard widget or in a related-entries chip anywhere in the interface.
Entries with a planning status show an orange Planned or grey Cancelled pill beside the title. Hover over the pill for an explanation, for example “This procedure is planned. Nothing on this page has been done to the subject yet; the date is the intended date. Mark it as performed once it has happened.”
Header buttons
The header of a details page offers, depending on the model and your permissions:
| Button | What it does |
|---|---|
| Edit | Opens the entry’s form |
| Duplicate | Creates a copy; subjects, sessions, specimen sets and episodes open a guided duplicate page, see Submission forms |
| Create Template | Saves the entry as a reusable template (procedures, specimen procedures, interfaces, data acquisitions, manipulations, episodes) |
| Graph | “Show this entry with its related entries” in the data graph, see below |
| History icon | Opens the revision history (requires change permission) |
| Trash icon Delete | Deletes the entry after a confirmation page. Shown on some details pages only, for example specimen sets and specimens; delete other entries from their form or from More actions in a list row. See Deleted entries |
| API | Opens the entry in the web API |
| Export | Download dropdown, see below |
| Planned pill | Shown while the entry is planned; the transition buttons (Mark as performed and others) are on its form. See Planning |
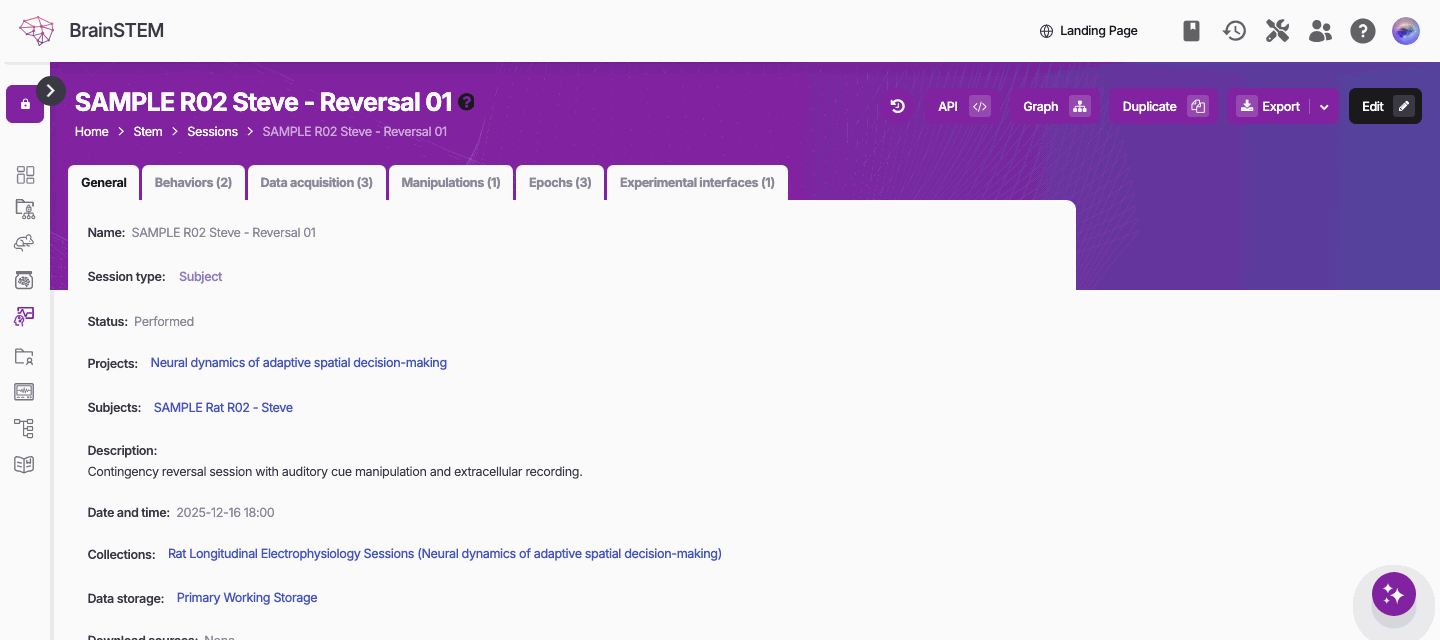
A session’s details page: history, API, Graph, Duplicate, Export and Edit in the header, the related entries as tabs.
Export dropdown
The Export dropdown (download icon) offers Print / Save as PDF and Download Word, on many entry types Spreadsheet (CSV, Excel…), and on projects also STAR Methods and Download project data. What each format contains and where else it is offered is described on Exports and reports.
Fields and details
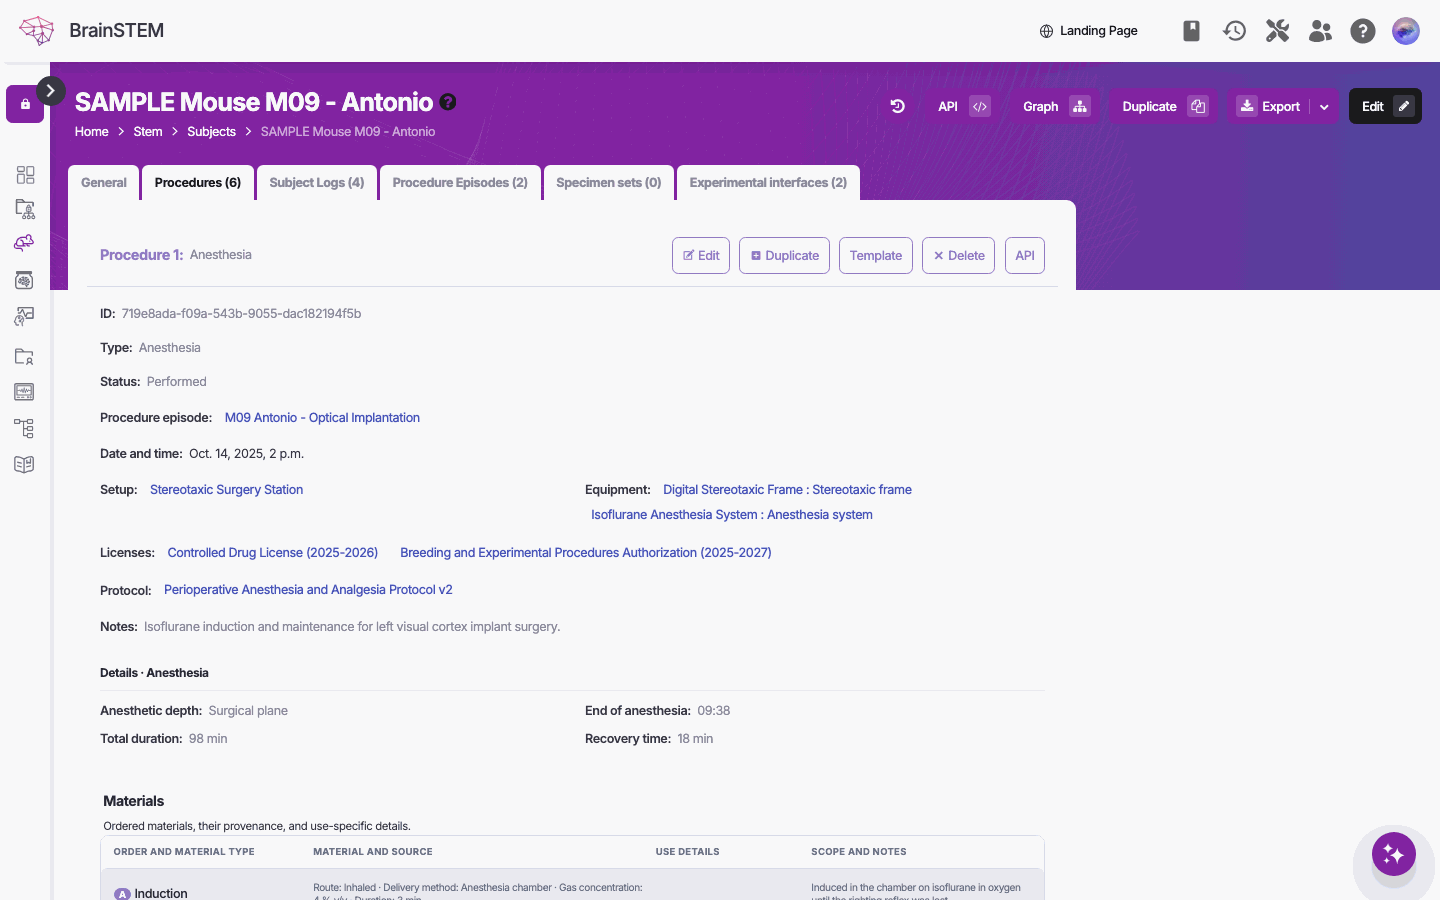
The page lists the general fields first, then the Details · {type} section with the type-specific fields using the labels from the type’s schema. Values with units are shown as “value unit”; tables and lists are expanded. Procedures with coordinates show a Coordinates · {system} heading with a View coordinates button that opens the coordinate viewer. Consumables of the silicon probe, ECoG array and optic fiber design types show a schematic drawing, see Probe catalog.
File attachments are listed by name and can be downloaded.
Related entries
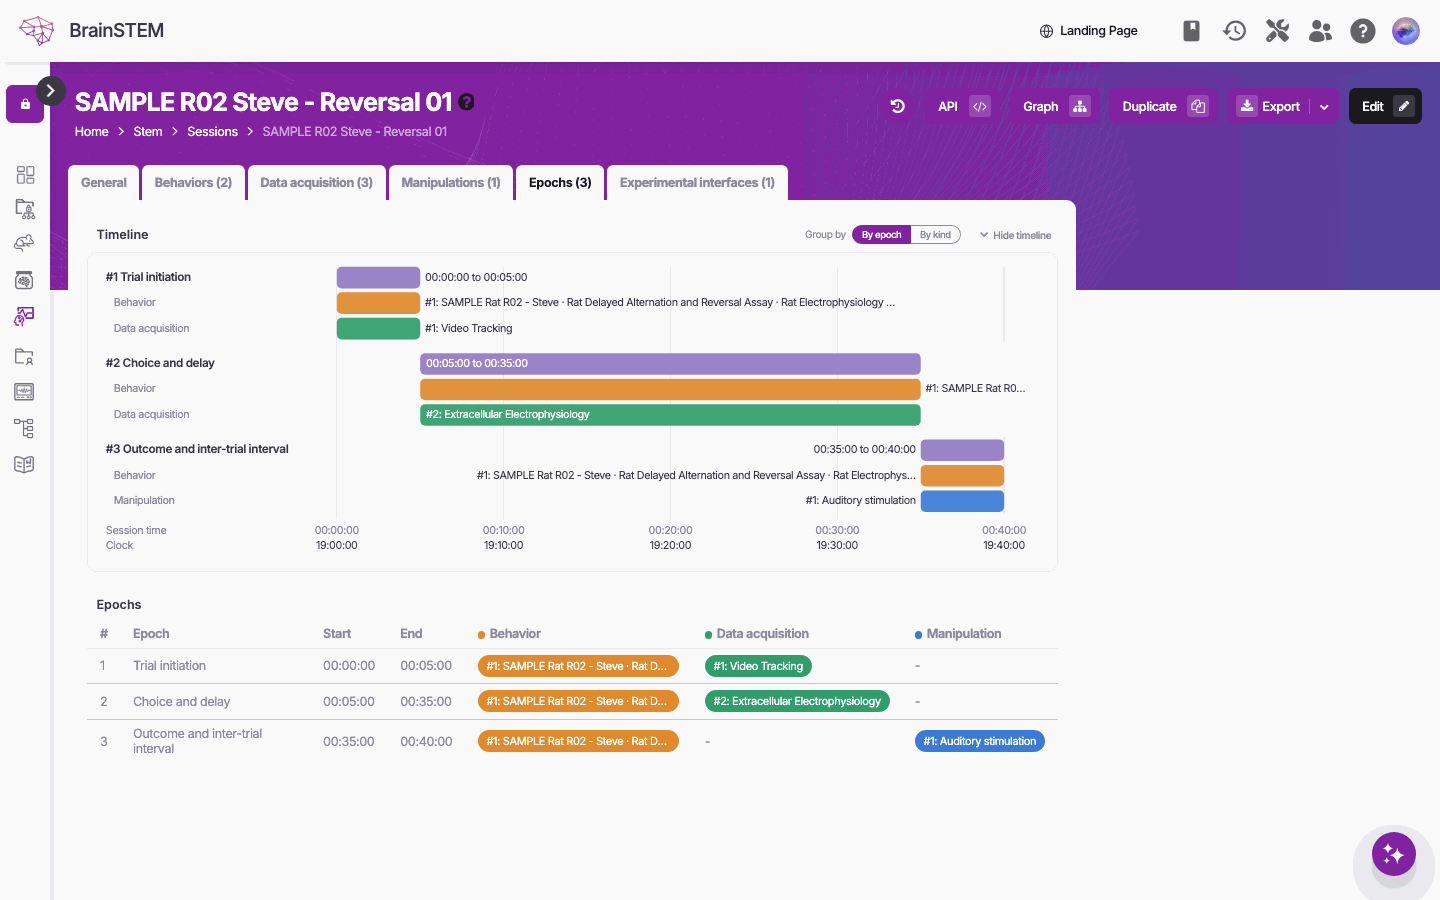
Related entries are shown as chips and tables, and link to their own details pages. Containers list their members: a project lists its subjects, sessions, collections, cohorts and specimen sets; a cohort its subjects; a collection its sessions; a breeding its offspring; a specimen its specimen procedures and derived specimens. Sessions have an Epochs tab with a read-only timeline and a table of epochs with their linked behaviors, data acquisitions and manipulations.
Consumable stock and catalog pages include a usage history table (Used in, Material type, Source, Use details, Targets) of the procedures and interfaces the material was recorded in.
Hovering over a chip or a name shows a summary popup of that entry.
Data graph
The Graph button opens the entry in the Data graph: your entries counted in boxes by kind, narrowed to what belongs to or is linked to the selected entry. Open a box to list its entries; pick an entry to narrow every count to it. The data graph is also reachable from Tools → Data graph, and the full model diagram from Help & Documentation → Interactive data model. A self-hosted version of the diagram is available on this site at Interactive data model.
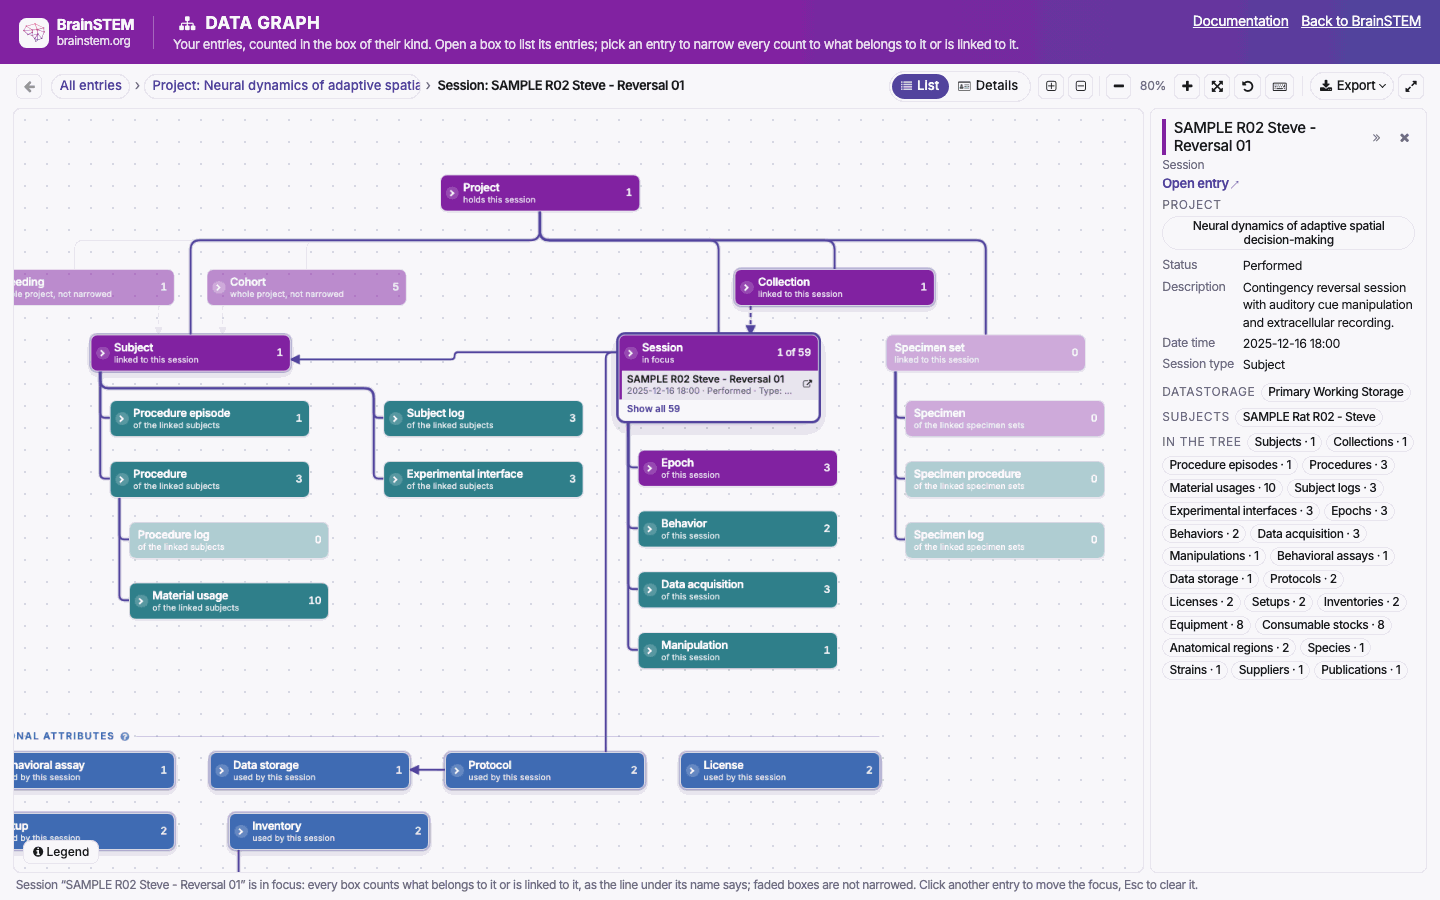
The data graph for a session: every kind of entry it belongs to or links to, counted, with the session’s details on the right.
Revision history
The history icon opens the list of saved revisions of the entry with Date/time, User and Action (for example “Changed name, description.”, “Updated via API.” or a planning transition). Choose a revision to see it and revert to it. The history is available to users with change permission on the entry; on projects it is limited to project owners. Subjects, sessions and specimen sets also link to their history from the change form.
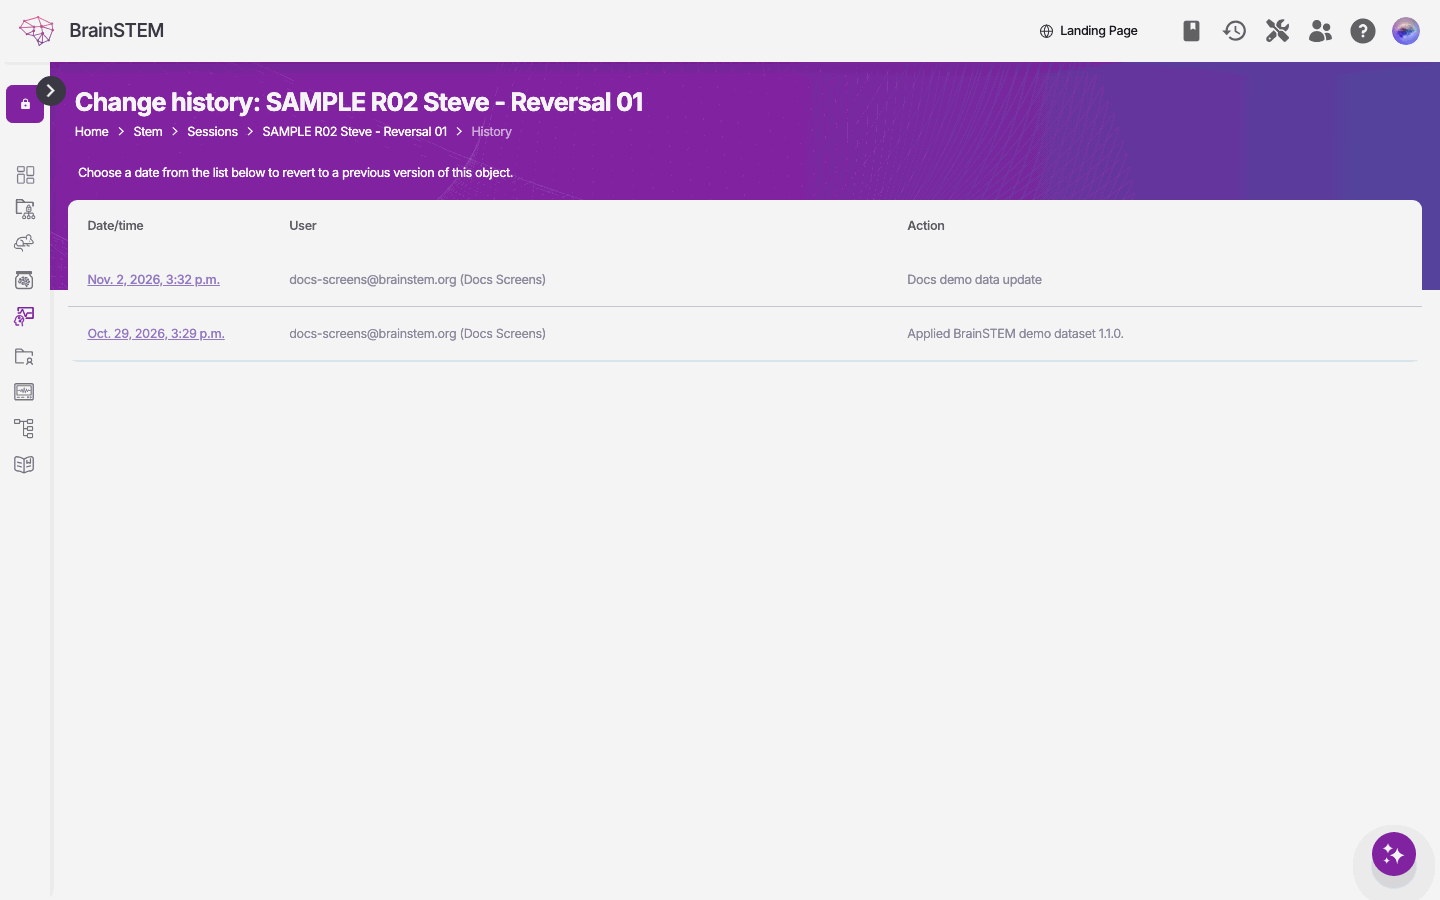
The change history of an entry: when it changed, by whom and why; choose a date to see or revert to that version.
Recover
A deleted entry disappears from its details URL. Use the Recover button on the list view of the model to find and restore it, see Deleted entries.
Public portal
In the public portal the details page shows the same fields read-only. Edit, delete, duplicate, template and export buttons are not shown to anonymous visitors. Planned entries are never shown in the public portal.
Related
- Submission forms: the Edit, Duplicate and Create Template actions in detail
- Exports and reports: every format in the Export dropdown
- Deleted entries: deleting, recovering and the revision history
- Planning: the Planned pill and the transition buttons on the form
- Atlases and coordinates: the View coordinates button
- Probe catalog: the schematic shown on probe designs