Dashboard
Overview
The dashboard is your landing page in BrainSTEM, providing quick access to your recent research activity and frequently used resources. Click on any item to navigate to its detail page.
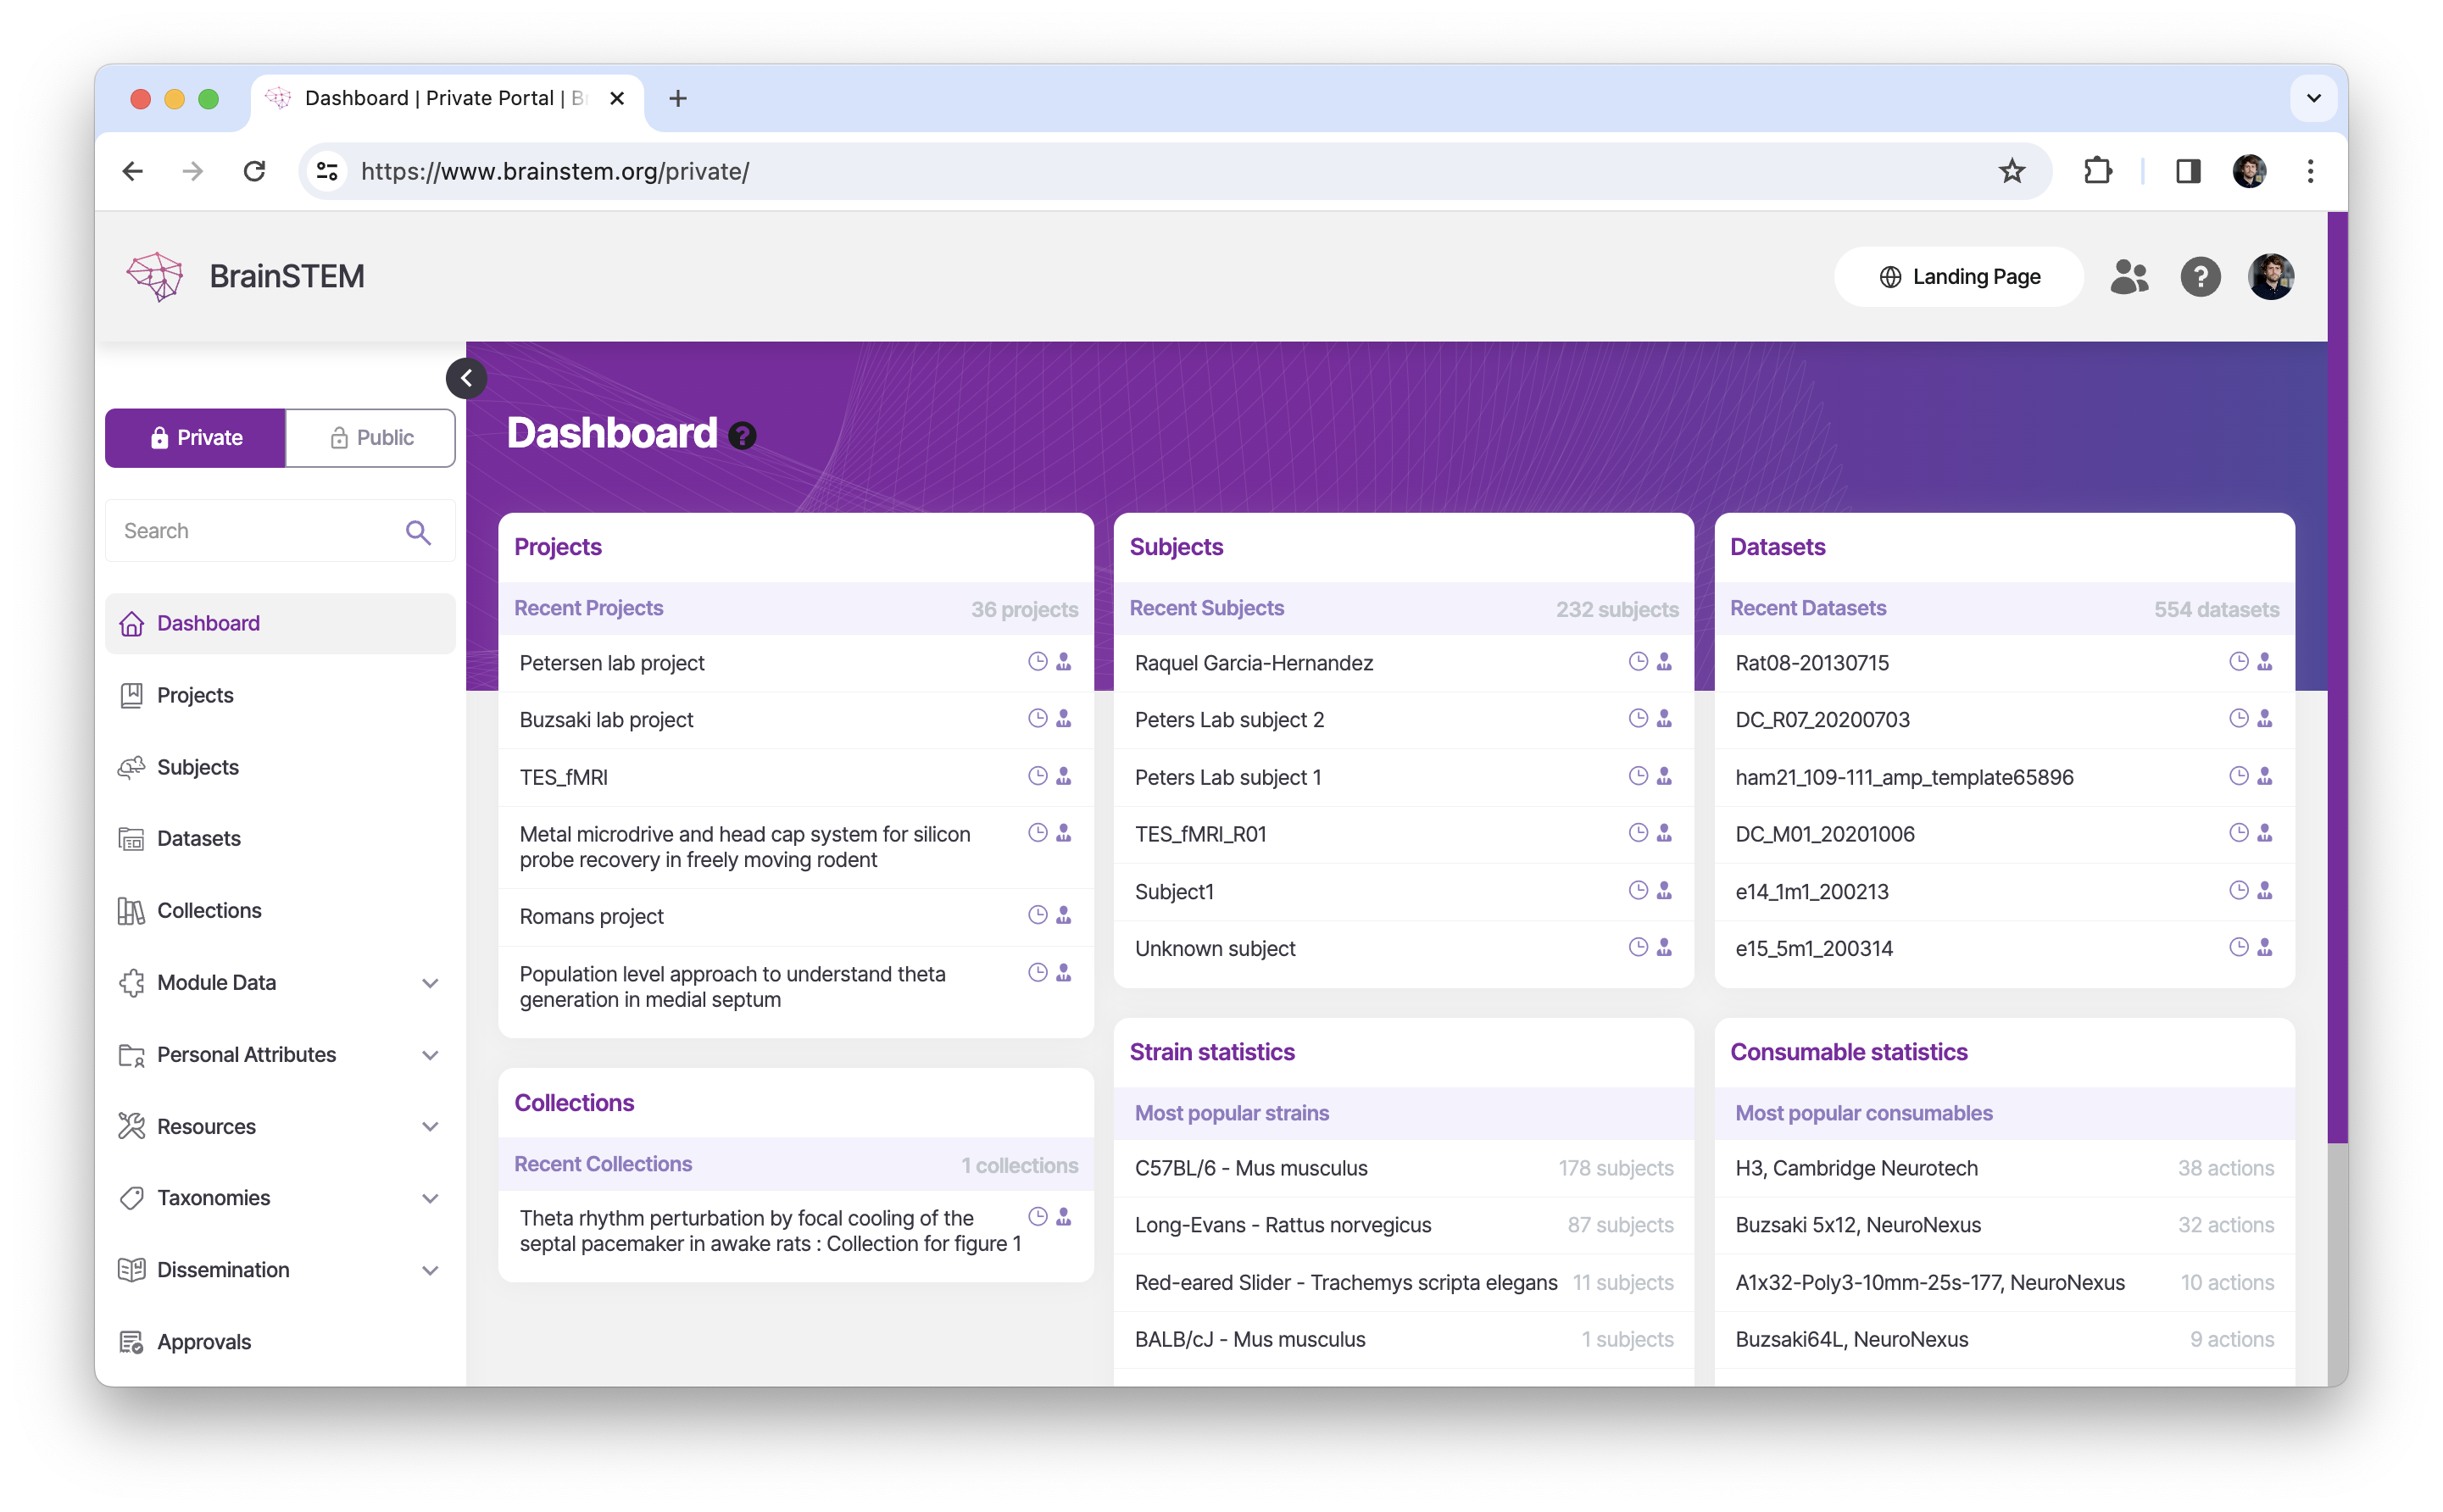 The BrainSTEM dashboard interface
Dashboard Components
Projects
Shows your most recently edited projects.
- Click on project names to navigate to project details
- View total count of projects you can access
Subjects
Displays recently edited subjects.
- Click on subject names to view full details and history
- Check last modified date to track recent updates
Sessions
Shows your most recent experimental sessions for immediate access to ongoing work.
- Click on session names to view full session details
- Check last modified date to track recent updates
Cohorts
Lists recently created subject cohorts (groups of subjects with shared characteristics).
- Click on cohort names to see member subjects
- Useful for organizing treatment groups, littermates, or subjects by experimental condition
Collections
Displays recent session collections (groups of related sessions).
- Click on collection names to view included sessions
- Useful for accessing multi-day experiments or related session groups
Statistics
Strain Statistics
The most commonly used animal strains across all users.
- View frequency of strain usage in your research
- Click on strain names to filter and see all subjects of that strain
- Useful for colony management and planning breeding strategies
Consumable Statistics
The most frequently used consumables (probes, drugs, viruses, etc.).
Hardware device statistics
The most frequently used Hardware devices (data acquisition devices, cameras, surgical equipment, etc.).
Navigation Tips
- Click any item name to view its detail page
- Hover over items to see quick action options
- Use the search bar (top right) to find specific entries
- Use the left sidebar navigation for full list views
- Filter data by project using the project dropdown